Lens — Network Monitor
Lens is a network visibility tool that shows you every connection your device makes. It monitors traffic in real time and helps you understand what applications are communicating and where.
Features
- Connection tracking — See all network connections with app, destination, port, and protocol
- Process resolution — Identify which application is making each connection
- Hostname detection — DNS cache and TLS SNI parsing for human-readable destinations
- Real-time monitoring — Watch connections as they happen
- Traffic map — Visualize connection destinations on a world map
- Export to CSV — Download connection data for offline analysis
Getting Started
- Open Camouflage Hub
- Click the Lens card (or use the View Traffic quick action)
- Toggle monitoring on in the Lens window
- View connections in real time
Lens does not require authentication — it monitors local network activity on your device.
Lens Window
The Lens window is a full-size (1400 x 900) resizable window with multiple tabs for different monitoring views.
Map Tab
The main view shows a world map with your connection destinations, application list with traffic bars, bandwidth stats, and summary cards. This provides a geographical visualization of where your network traffic is going.
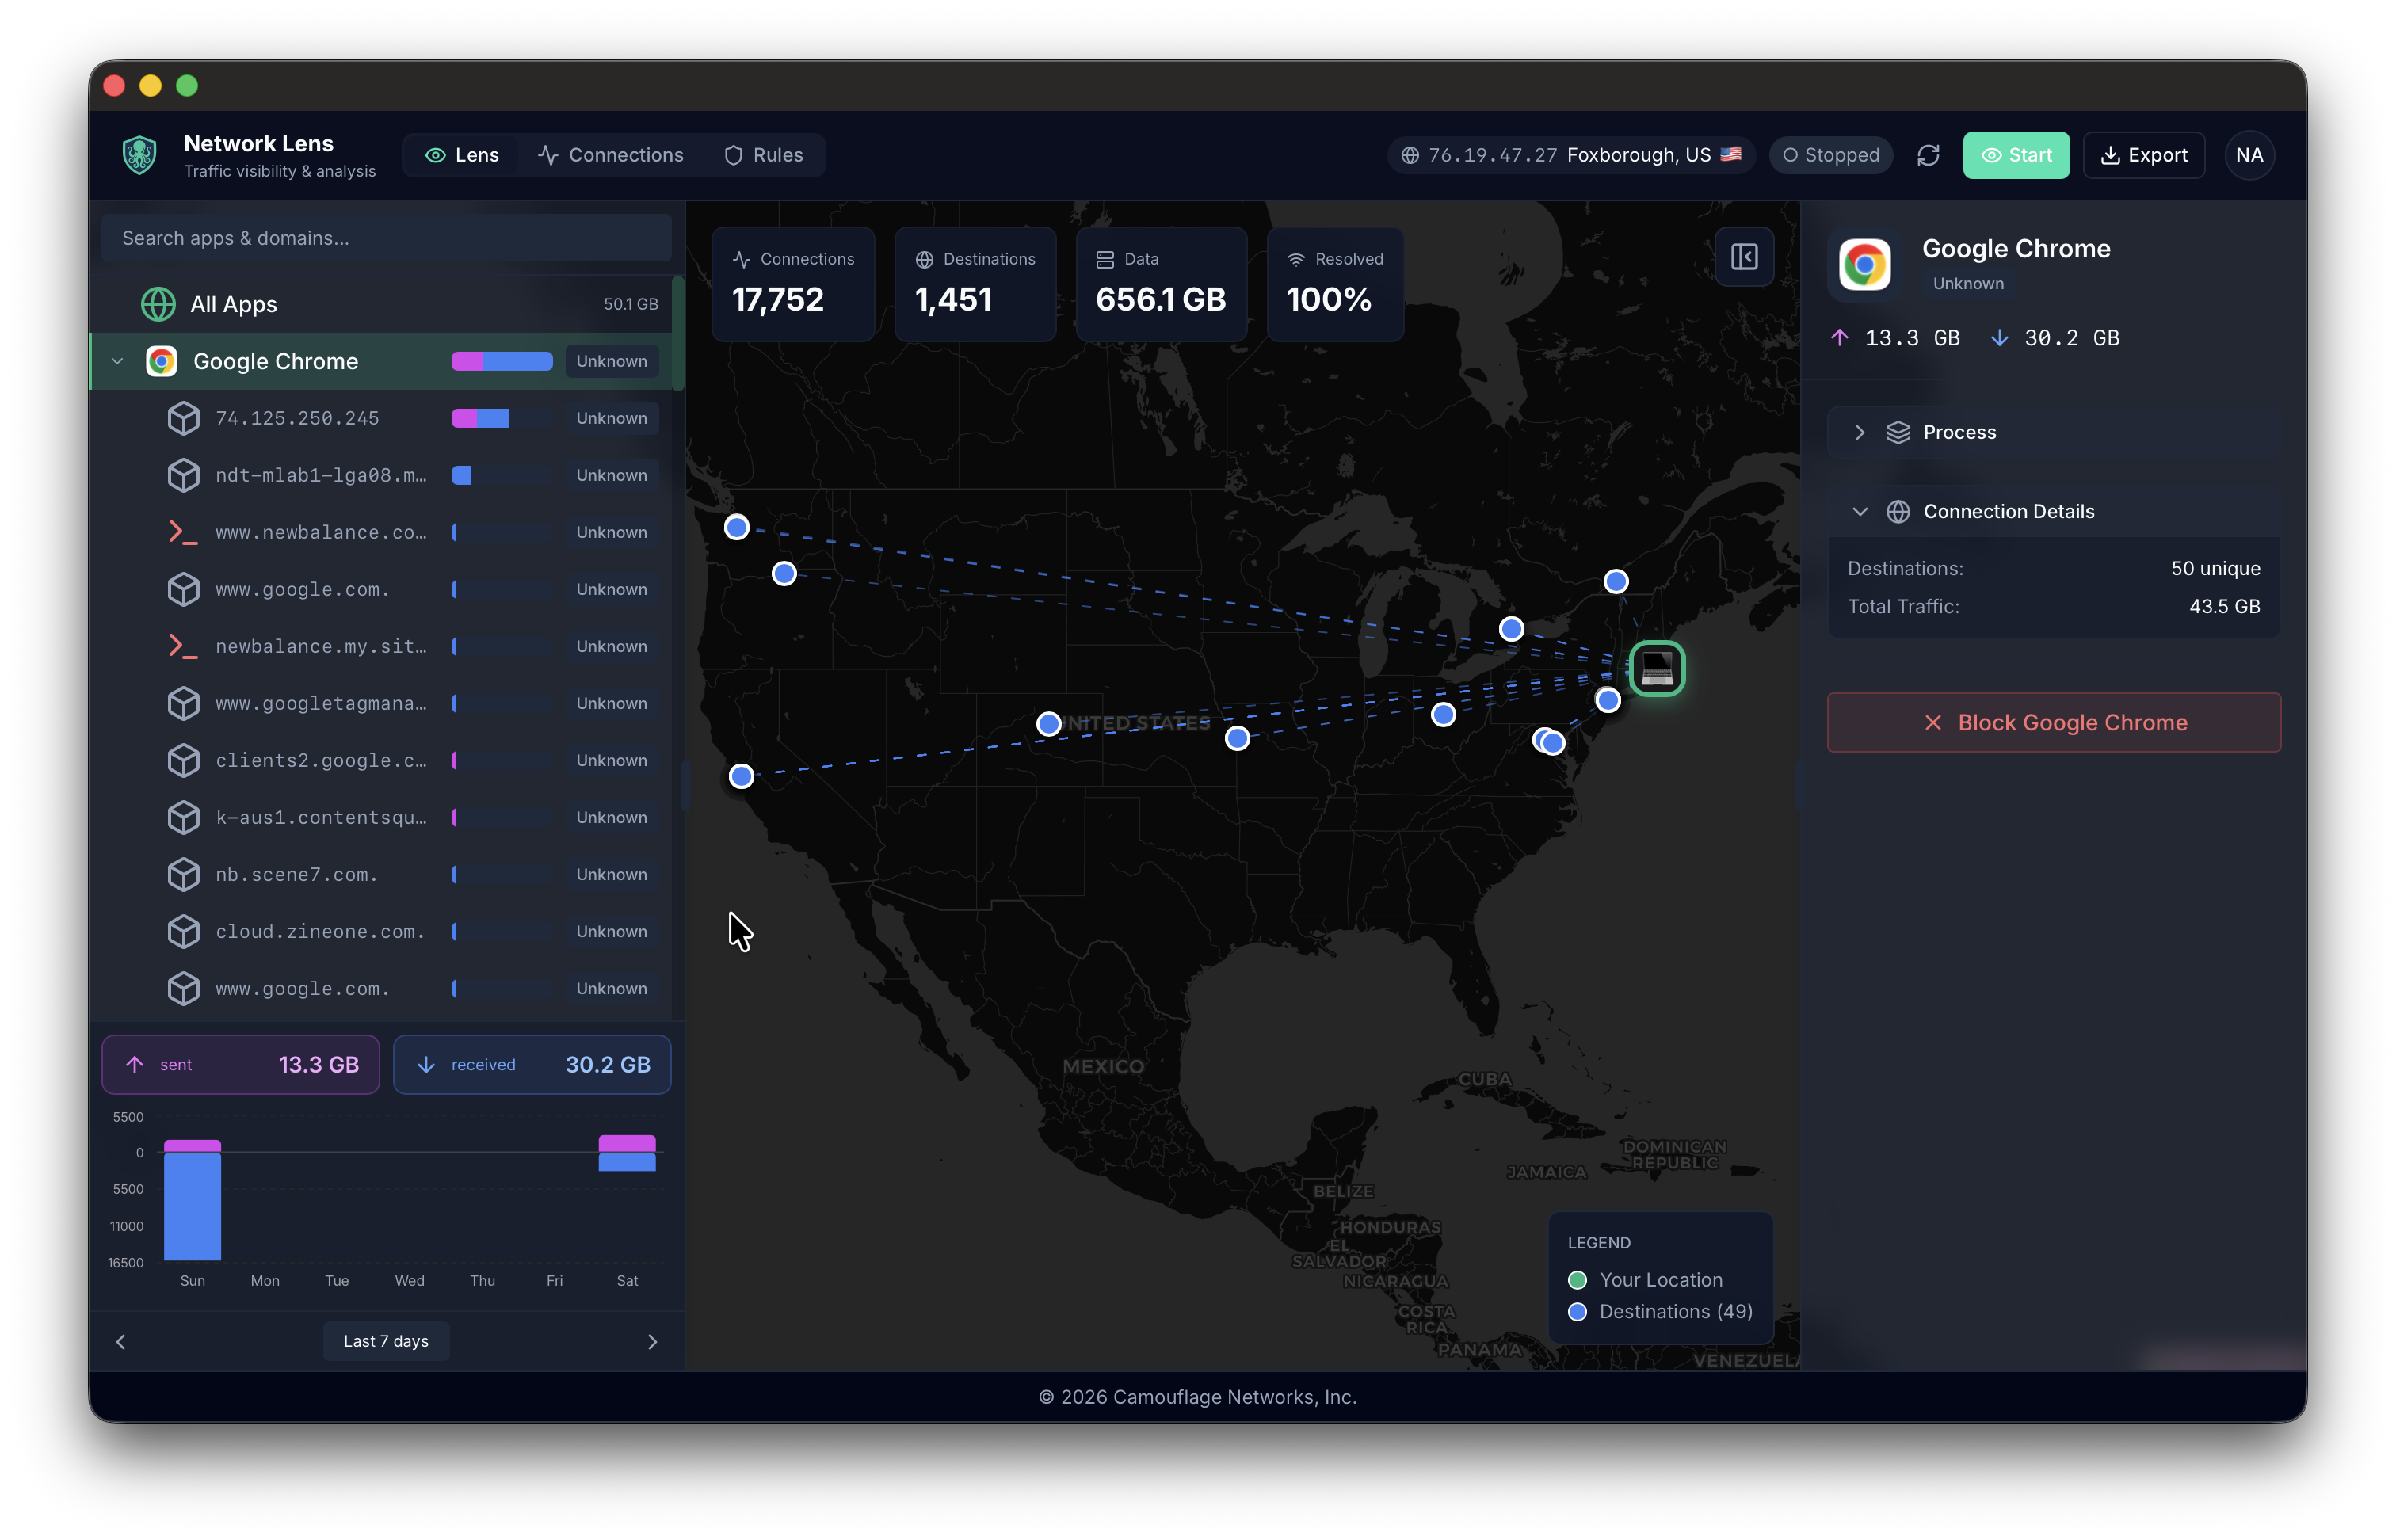
Map Features:
- Geographic visualization of connection destinations
- Real-time traffic flows shown with animated lines
- Application sidebar with traffic volume bars
- Summary statistics at the top of the window
Connections Tab
A sortable, filterable data table showing every connection with full details. This is the primary view for detailed network analysis.
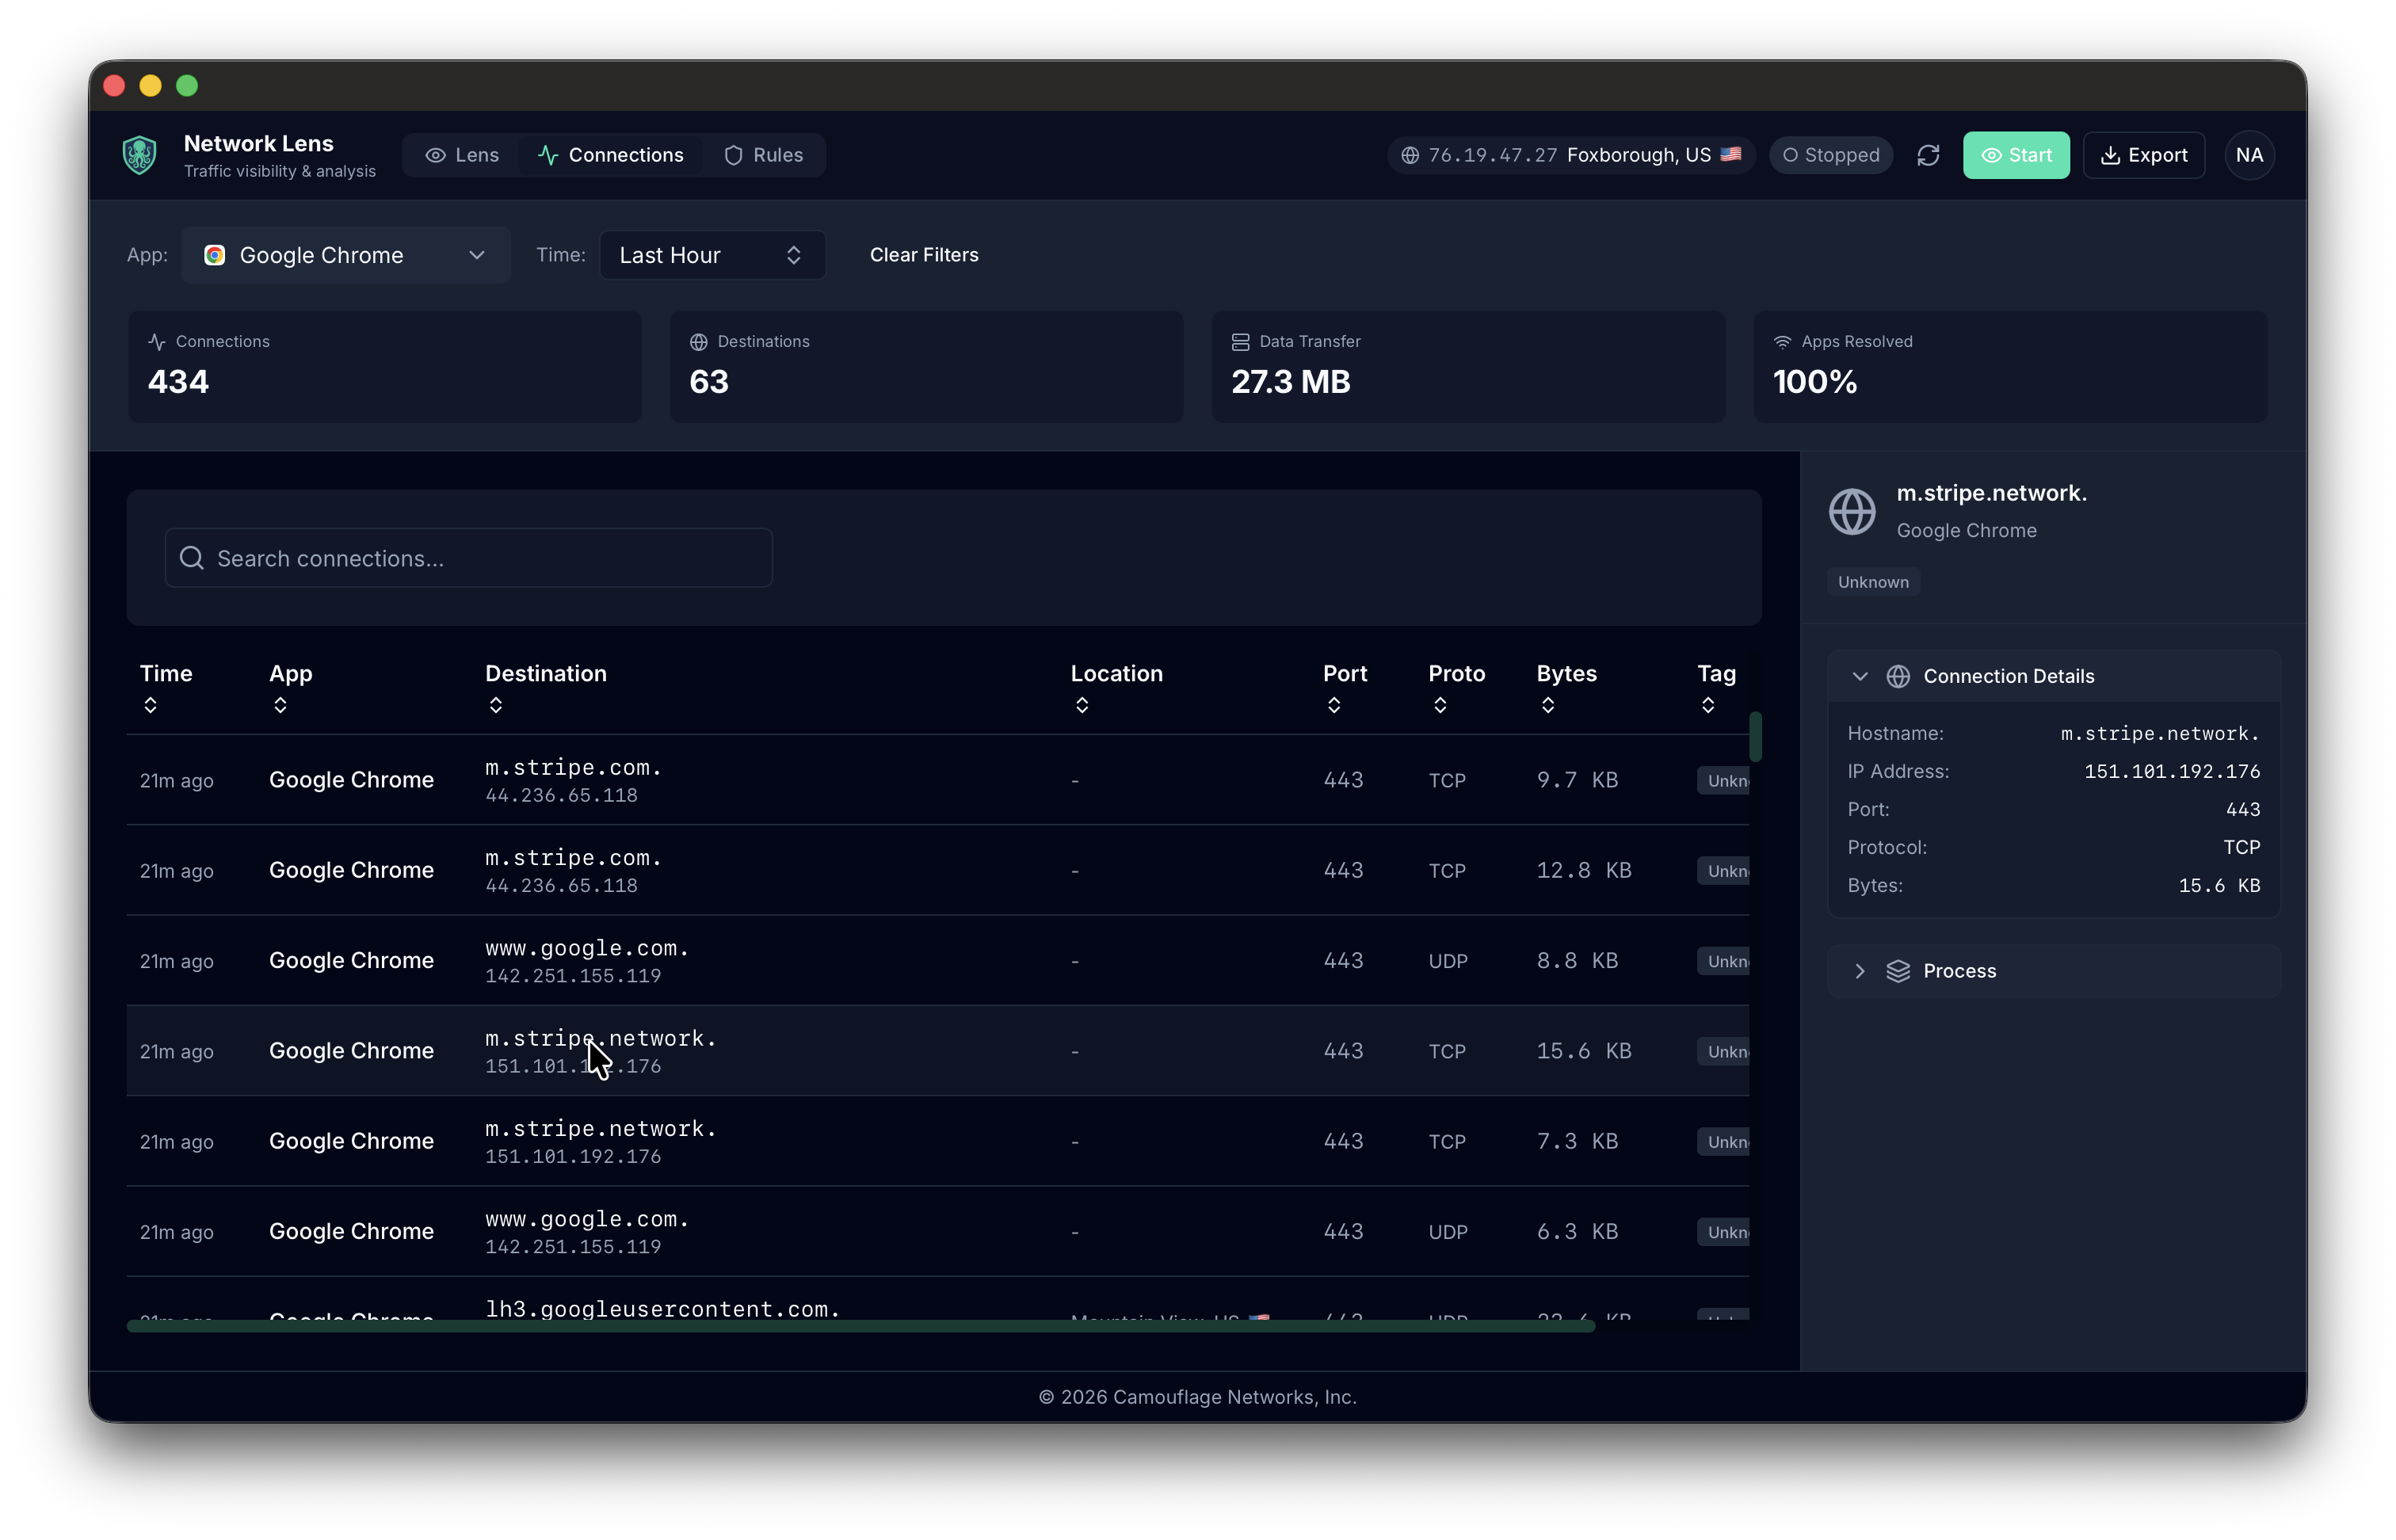
Connection Details:
- Application name and icon
- Destination hostname or IP address
- Port number and protocol (TCP, UDP, ICMP, etc.)
- Bytes sent and received
- Connection timestamp
- Country of destination
Filtering and Search:
- Filter by specific application
- Filter by time range
- Search across all fields (hostname, IP, app name)
- Sort by any column (click column headers)
- Click any row to see full connection details in the side panel
Rules Tab
Create firewall-like rules to filter or block specific applications or destinations. Rules are enforced when Lens monitoring is active.
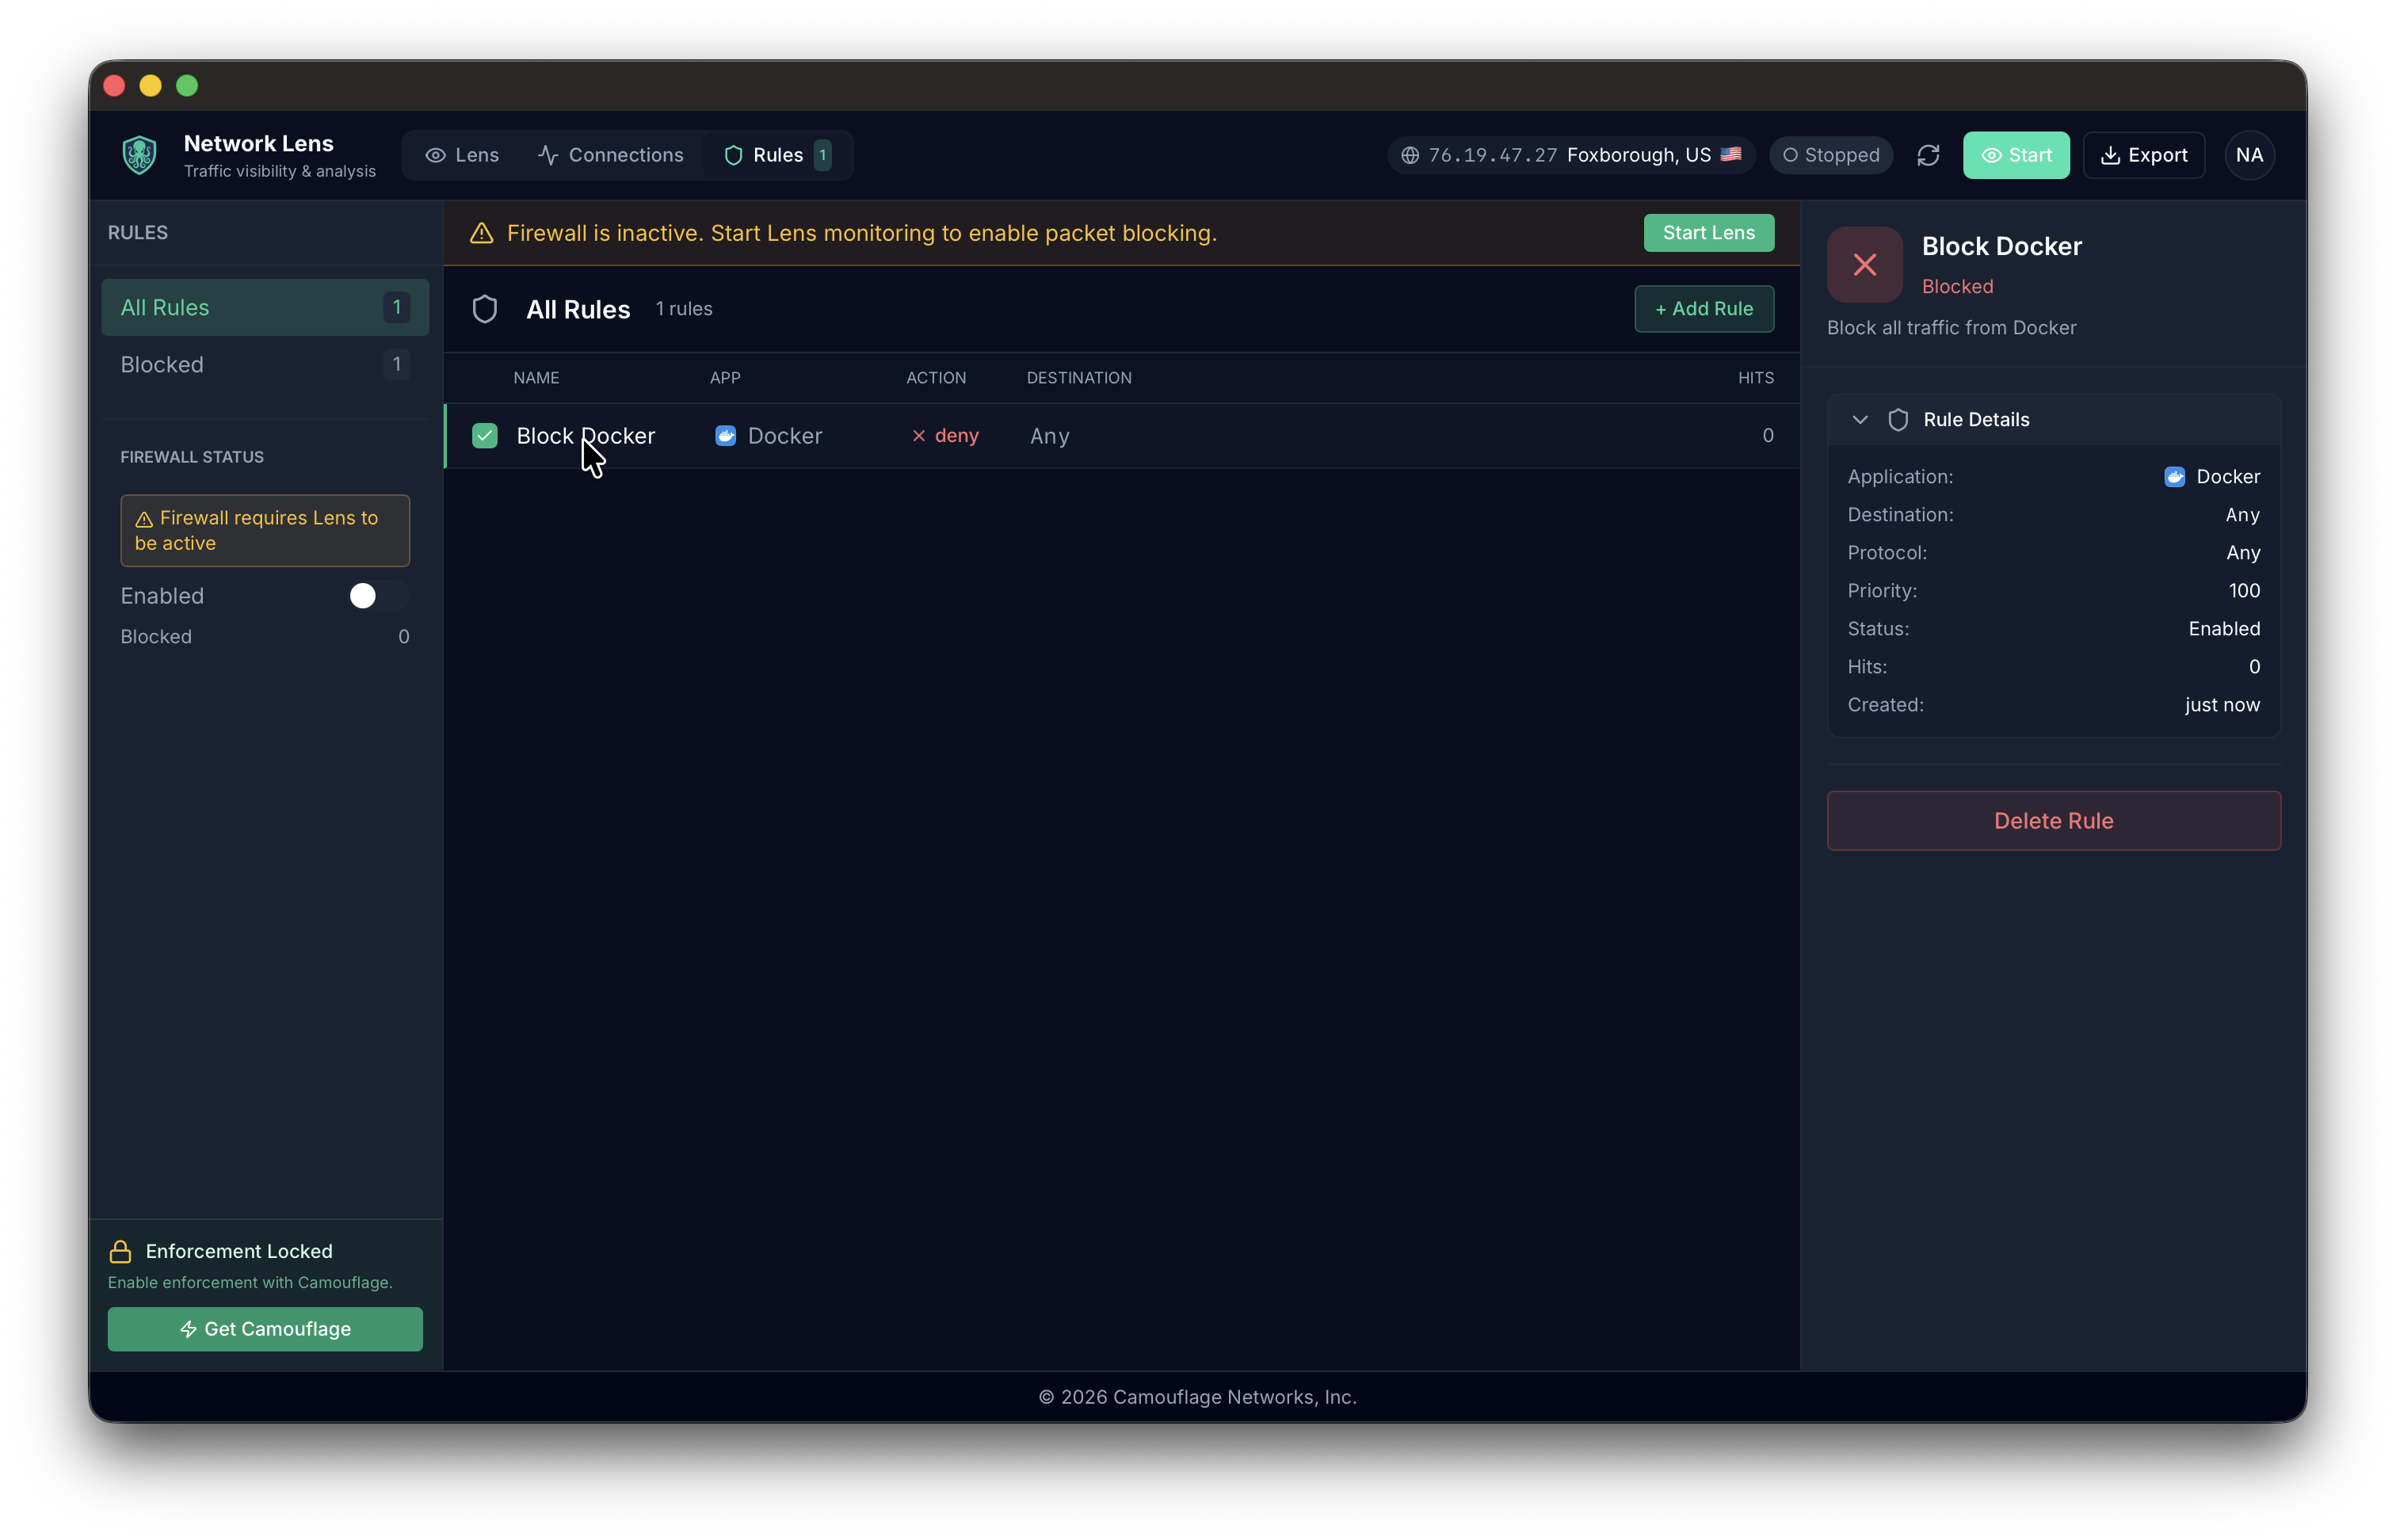
Rule Types:
- Block specific applications from accessing the network
- Block specific destination IP addresses or hostnames
- Block by port or protocol
Rules take effect immediately when monitoring is active. Use this tab to implement basic network security policies.
Rates Tab
Real-time bandwidth monitoring showing current data transfer rates per application and connection.
Metrics:
- Upload and download rates in real time
- Per-application bandwidth usage
- Total system bandwidth
- Historical rate graphs
How Lens Works
Lens provides deep network visibility by intercepting and analyzing all network traffic on your device. Here's how it works under the hood:
Traffic Interception:
- Creates a virtual TUN (network tunnel) interface to capture all network packets
- Routes traffic through the Lens monitoring layer before it reaches the network
- All processing happens locally on your device
Application Resolution:
- Uses operating system APIs to identify which application made each network connection
- On macOS, this uses process information from the kernel
- Displays application names and icons in the connection table
Hostname Detection:
- Resolves destination hostnames using DNS response caching
- For HTTPS traffic, extracts the Server Name Indication (SNI) from TLS handshakes
- SNI provides the hostname even when DNS wasn't observed
- Falls back to IP address when hostname cannot be determined
Data Storage:
- Connection history is stored in a local SQLite database
- No connection data is sent to Camouflage servers
- All analysis and monitoring happens entirely on your device
Privacy:
- Lens only sees metadata (source, destination, size, protocol)
- Packet contents are not logged or stored
- Geographic location is derived from public IP geolocation databases
Permissions
Lens requires network-level access to monitor traffic. The first time you start monitoring, you may see permission prompts.
macOS:
- Network extension permission prompt on first use
- System Settings > Privacy & Security > Network Extensions
- You must approve the Camouflage network extension
- The Camouflage system daemon must be running (automatically started by the app)
Why These Permissions:
- Creating a TUN interface requires elevated privileges
- Network traffic interception is a protected operation
- The daemon runs as a privileged process to handle low-level networking
If monitoring fails to start, check that:
- The daemon is installed and running (use the Hub status card)
- Network permissions have been granted in System Settings
- No conflicting VPN or network monitoring tools are active
Performance
Lens is designed to have minimal impact on network performance and system resources.
Tested Performance:
- Sustained throughput: 146 Mbps download / 42 Mbps upload through NAT
- NAT table lookups: Sub-microsecond latency
- CPU overhead: Minimal (processes packets in efficient Rust code)
- Memory: Connection metadata stored efficiently in SQLite
Optimizations:
- Zero-copy packet processing where possible
- Efficient connection state tracking
- Background thread for database writes
- Icon caching to avoid repeated lookups
Lens monitoring should not noticeably affect your network speed or system performance under normal usage.
Hub Status
On the Hub, Lens shows:
- Monitoring (green) — Lens is actively capturing connections
- Idle (grey) — Monitoring is off
Summary Statistics
At the top of the Lens window you can see at a glance:
- Total connections observed
- Unique destinations reached
- Total data transferred
- App resolution percentage
Export
Lens allows you to export connection data to CSV format for offline analysis, security audits, or compliance reporting.
How to Export:
- Go to the Connections tab
- Apply any filters you want (optional — you can export filtered or full data)
- Click the "Export to CSV" button in the toolbar
- Choose a save location
- The CSV file will contain all visible connection records
CSV Contents:
- Timestamp (when connection was established)
- Application name
- Destination hostname or IP
- Port number
- Protocol (TCP, UDP, ICMP, etc.)
- Bytes sent
- Bytes received
- Country code
- Duration (if connection has closed)
Use Cases:
- Security audits: Review all network activity for a specific time period
- Compliance: Document network access for regulatory requirements
- Troubleshooting: Analyze connection patterns for misbehaving applications
- Reporting: Generate summaries of network usage
- Analysis: Import into spreadsheet or data analysis tools
The exported CSV can be opened in Excel, Google Sheets, or any data analysis tool. All timestamps are in ISO 8601 format for easy parsing.